
LASTRADA Master Data keeps everything together
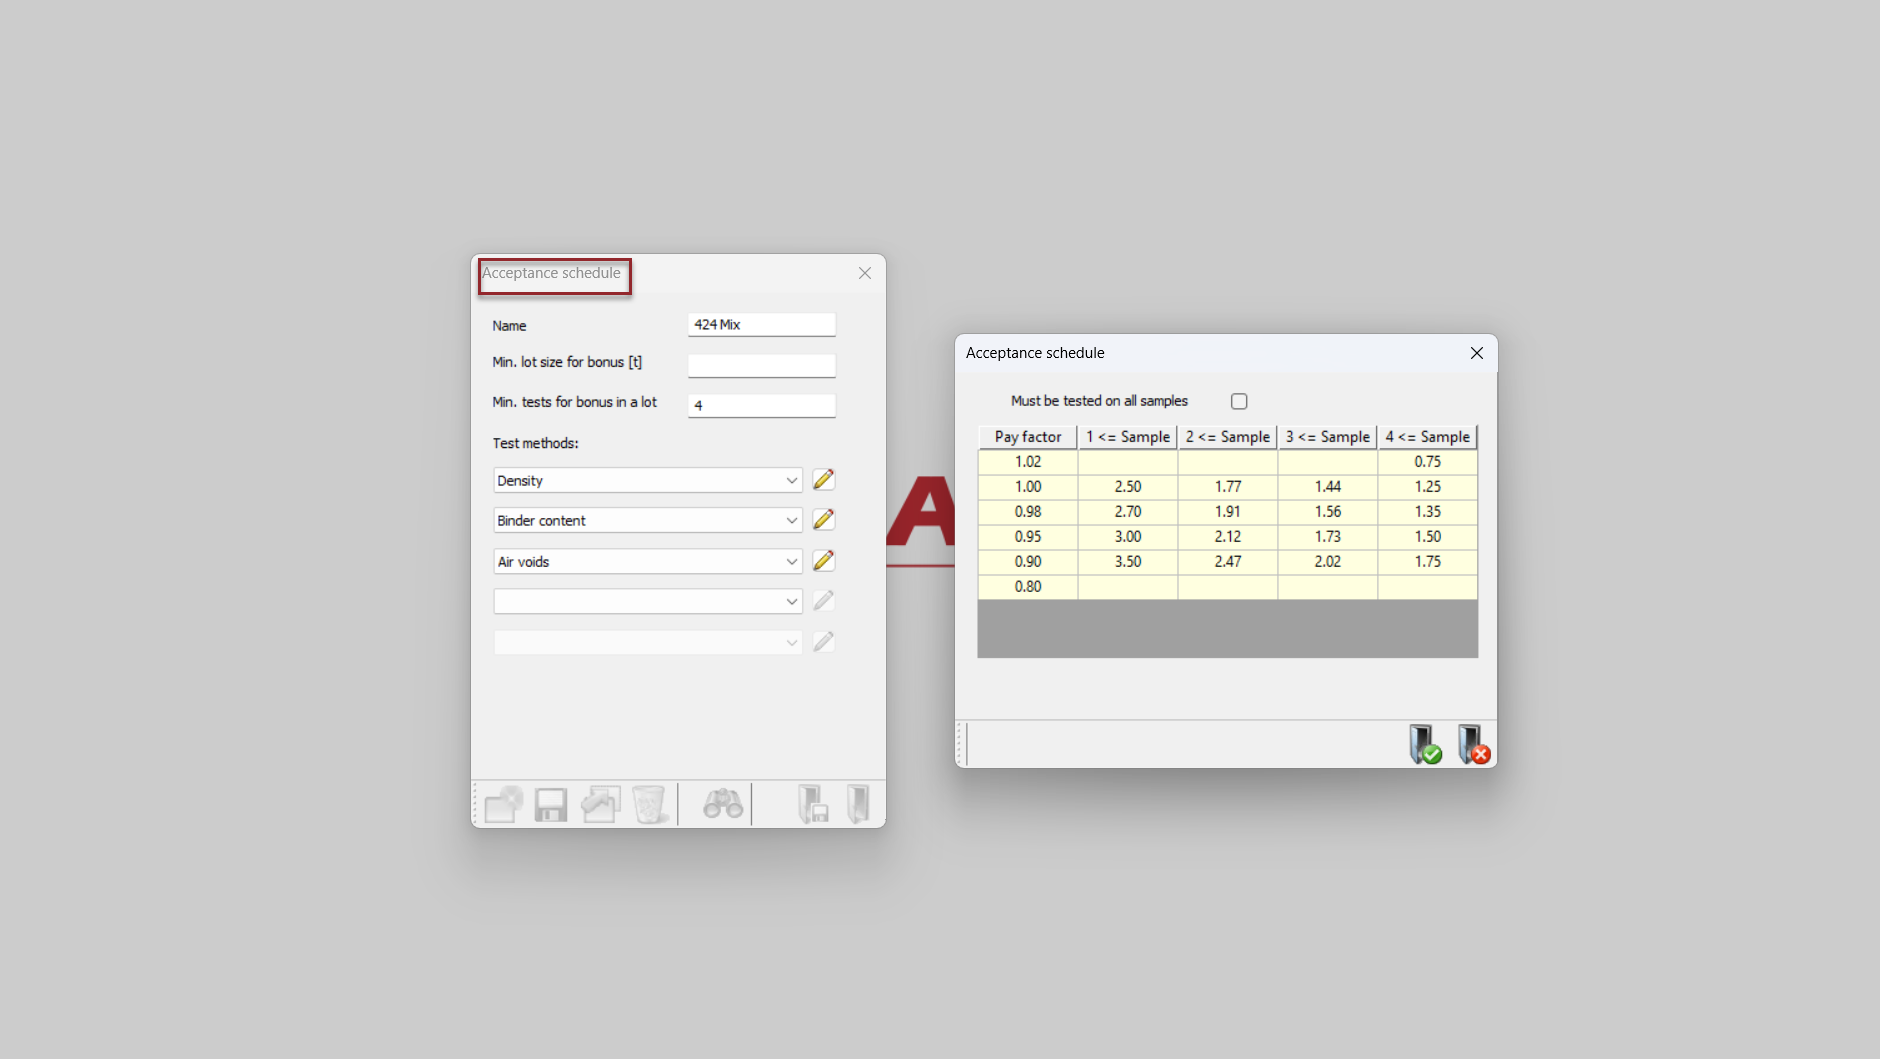
Users build an acceptance schedule matching their local specification requirements.
Review Pay Performance Live
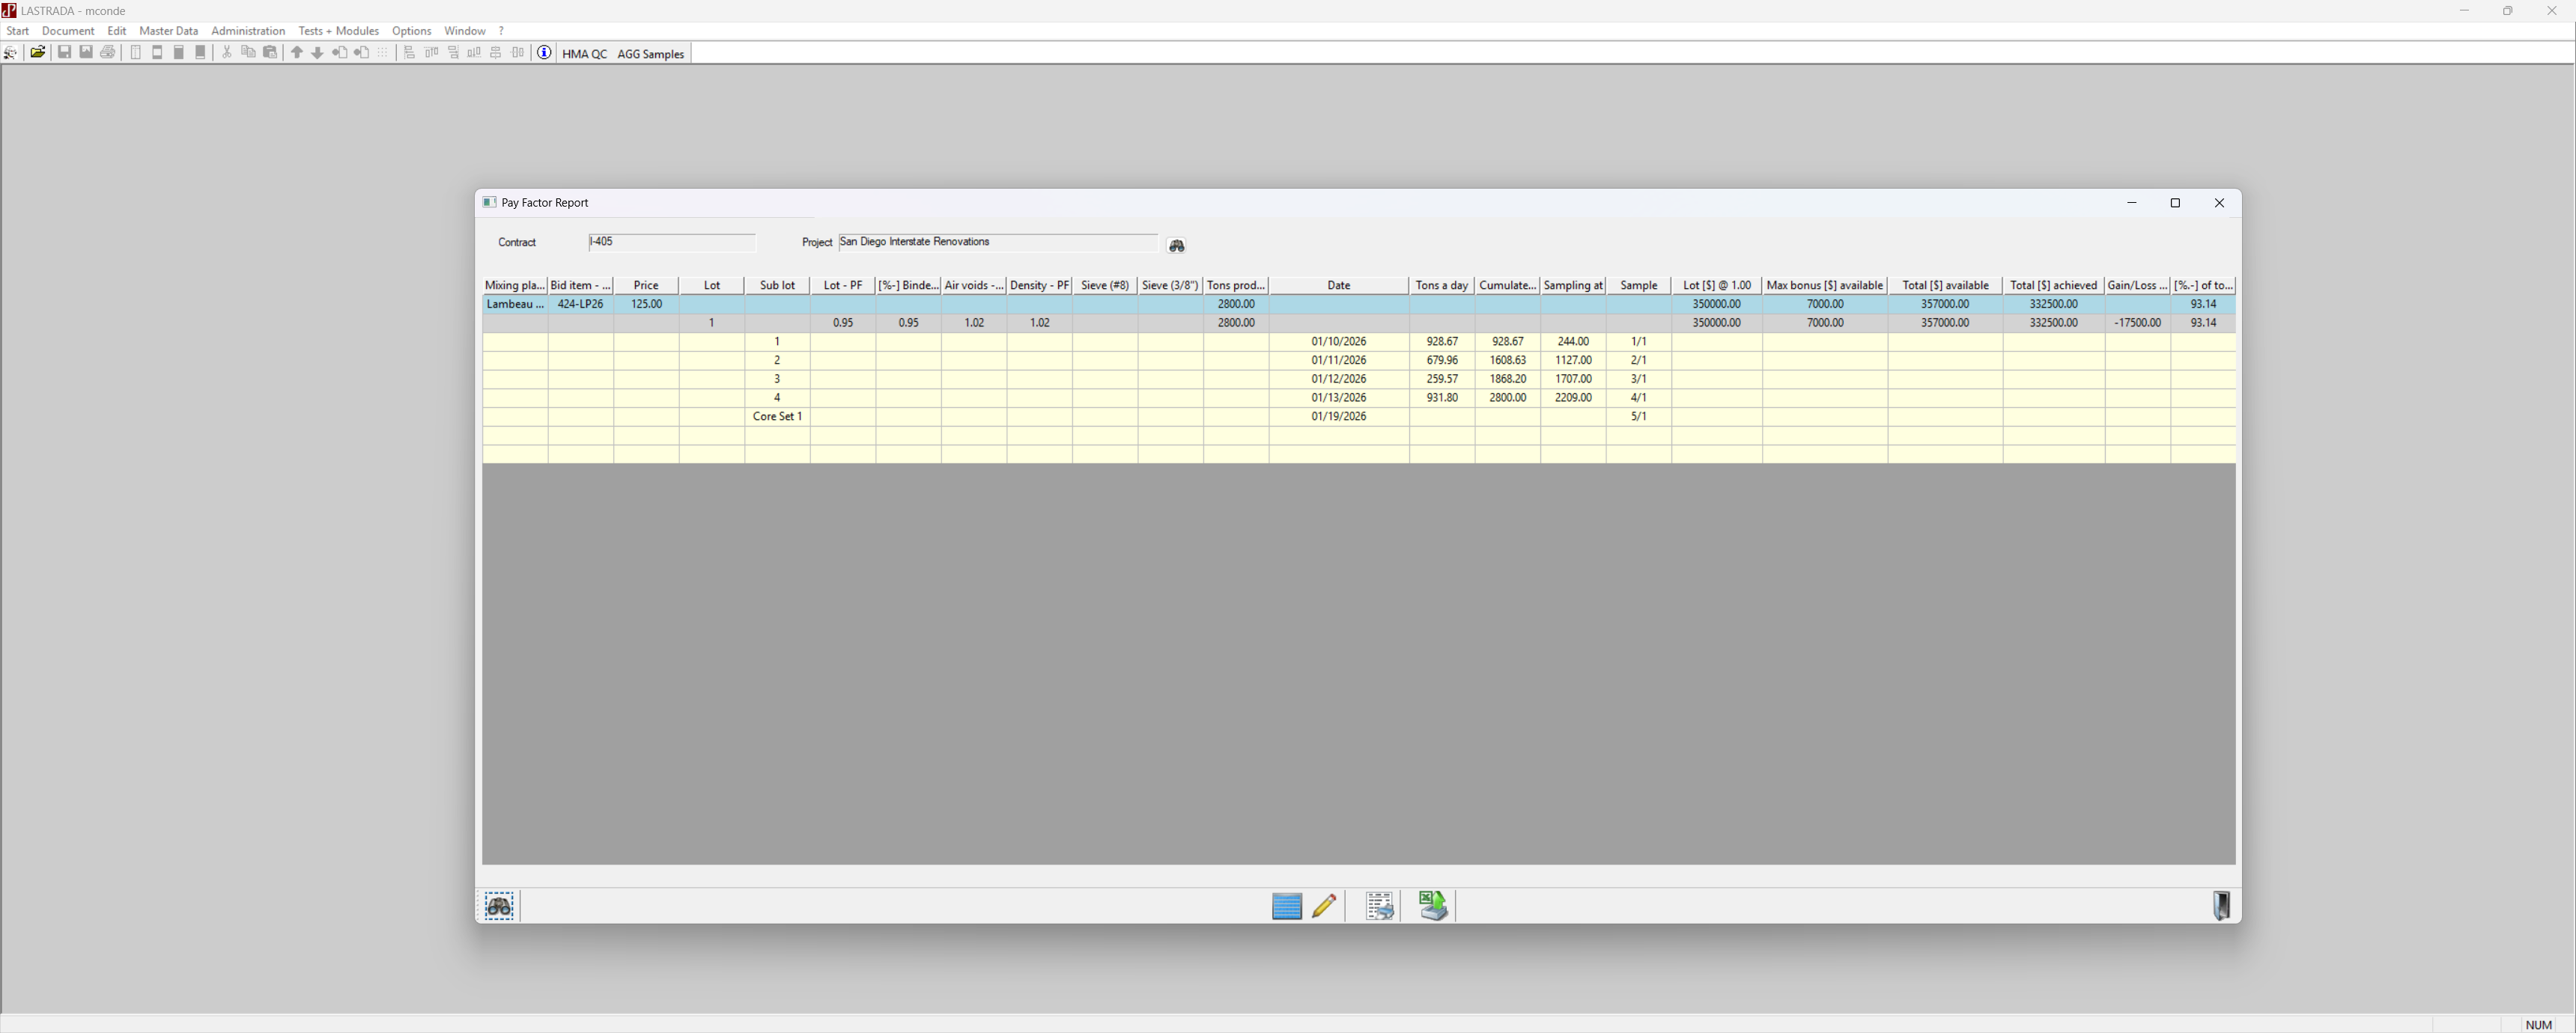
The contract information, acceptance schedule, QC test results, and tonnages are combined to evaluate mix pay performance in real time with no duplicate data entry.
Gives Managers Real-time Visibility into Pay Performance
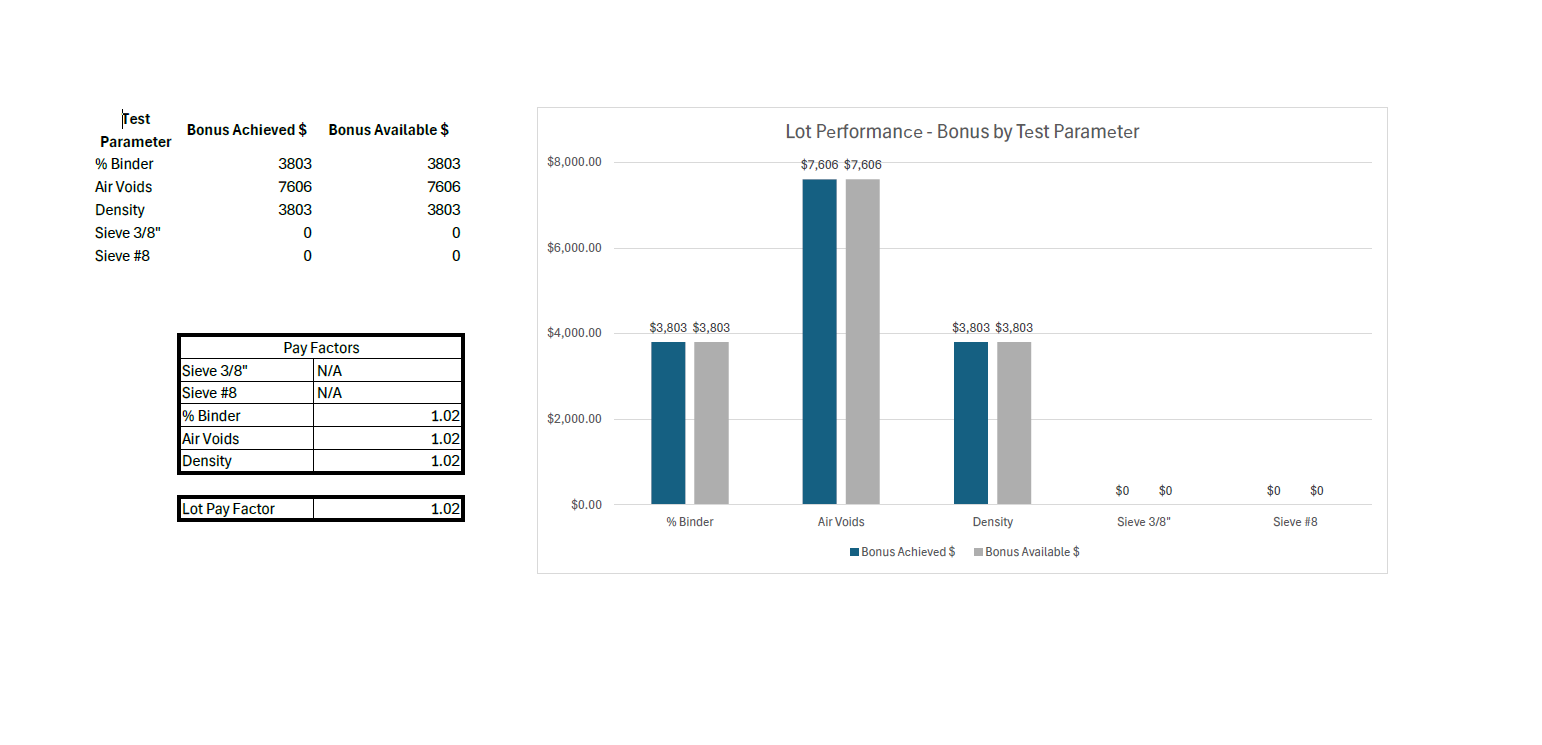
Real time pay results from the pay factor module can be fed into dashboarding systems such as Power BI, Tableau, and other platforms via RESTful API endpoints.
VIDEO TRANSCRIPT
In this Lightning Demo, I'll introduce LASTRADA's new factor module, which gives real-time page performance for a project plan or region. LASTRADA calculates pay performance using QC and GMF data tonnages and bit-item information. This feature allows all stakeholders to understand the impact of QC tests in real time.
In LASTRADA's Master Data, users build an acceptance schedule matching their local specification requirements. Asphalt tons are entered and are important in the operating compliance module.The contract information, accepts the schedule, QC test results, and tonnages are combined to evaluate mix pay performance in real time with no duplicate data entry. In the pay factor overview, you can view the max bonus, total available to achieve, and the gain and loss numbers. The Pay Factor module has a native Excel-based reporting feature. Real-time pay results from the pay factor module can be fed into dashboarding systems such as Power BI, Tableau, and other platforms via RESTful API endpoints.
This allows performance to be dashboard, combined and compared with other data to create a powerful QC management tool.
Thank you for watching. For more ways LASTRADA can simplify your work. Check out our other Lightning Demo videos at www.lastradapartnes.com/resources, or visit our contact page to speak with one of our engineers.

