
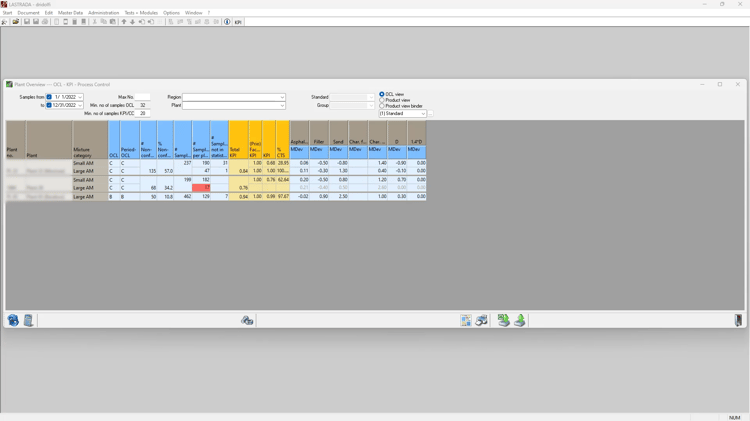
Plant Overview with Scores
This view shows you a customizable plant list with scores to quickly find high-performing plants and plants with opportunities for improvement.
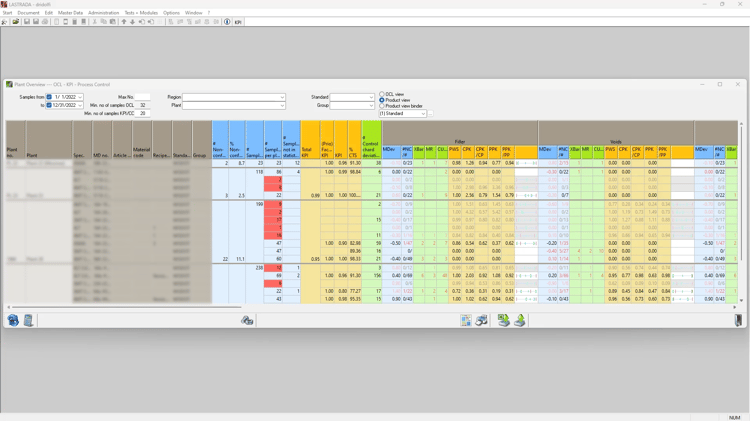
Production Overview
In this view, you can see all the individual summary statistics that make up those scores. The KPI score includes basic statistics, Moving Range, CUSUM, and Six Sigma analyses. The product view also includes a data visualization showing the mean and standard deviation, along with the specifications.
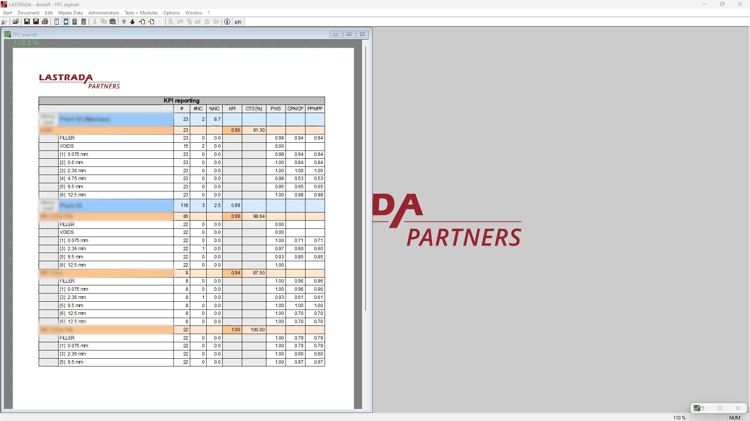
Reporting Options
A summary report showing all the products with KPI data organized by plant is available. A report drilling down into individual product properties is also available.
VIDEO TRANSCRIPT
Material producers, have you taken the time to look at the overall health of your operation? Can you shine a light on which plants and which products are struggling or are doing so well that their practices need to be applied to others? In this Lightning Demo, I will show you how LASTRADA's KPI module provides a holistic view of your operation, helping you build a competitive advantage.
LASTRADA has analyzed over 5,000 data points for me and given each of these three plants a score C, C and B in this case. I can switch to a product view to look at all of the products that roll up into each of these plant scores. Let's go ahead and do that. Now, I can see all the individual summary statistics that make up those scores. The blue section over here shows us the number of samples tested and the number of samples that were out of specification. LASTRADA also provides a simple visualization of the data. Let's look at the filler for these last two products shown on this view. The red bar gives us our specifications, the green bars show us two standard deviations, and the green line shows us our average.
In this first example, you can see the average of this data is on the far right or near the high side of the specification, resulting in a low percentage within the limit. On the next one down, you can see the standard deviation is very low relative to the specification, resulting in a high percentage within the limit. A KPI report is also available to share these results with all stakeholders. Let's take a look at that report. Here's the field report to be shared with all stakeholders within your organization. I can also click on one of the plants and get further details about the consistency of the material. If I want to get further details about a property of a mix that is concerning or anything I want to evaluate, I can click on that mix and run a report that gives me further details about that one property and product. Here's that completed report with basic statistical information as well as Six Sigma statistics, a KPI score, and the visualization we looked at earlier. That visualization in this report now also includes the shape of our frequency distribution. Down below, we have moving range charts and CUSUM charts.
For more ways you can simplify your work, check out our other Lightning Demo videos at www.lastradapartners.com/resources or visit our contact page to speak with one of our engineers.

