In LASTRADA's KPI module, which can be found in both the Aggregate Production QC module and Asphalt Production QC module, we can look at all of the plants together.
Compare and Benchmark Plants
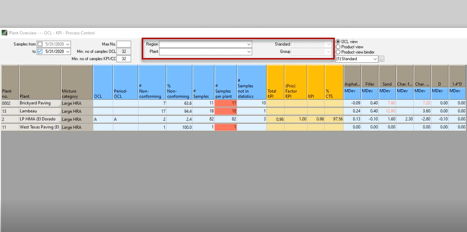
Using filters, we can compare and benchmark plants, regions, and companies against each other.
Narrow Your Search
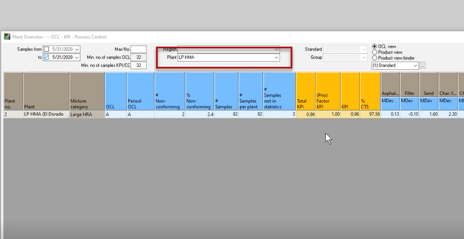
Focus in on a specific plant to see various factors like Operating Compliance Level (OCL) grade, KPI, PWS, and more.
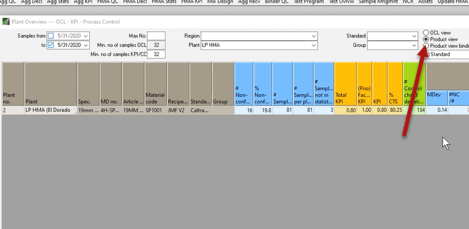
Narrow your search even more to look at a product. Technicians can use this straightforward view to see a product's quality.
Use Graphics
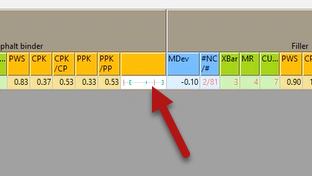
Use the visual bar to see the specification range, standard deviations, variance from the average, and where the average stands.
Customize Your View
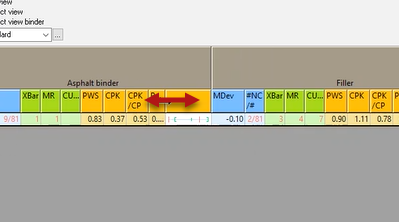
Too much information? Simply drag and close cells that aren't relevant to create a customized view.
Prioritize Your Products
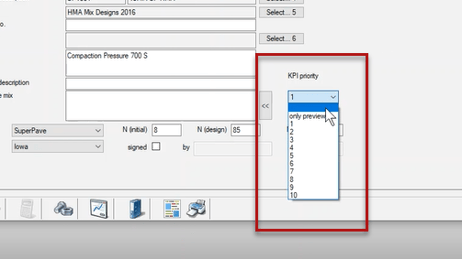
Using the drop down menu in LASTRADA's Asphalt Declaration Module, you can prioritize all the products you're producing and exclude low-risk products.
For more information on how LASTRADA helps asphalt producers, visit our asphalt solutions page.
VIDEO TRANSCRIPT:
As engineers, we like to look at a lot of information. The more calculations the better and more numbers make us feel warm and fuzzy inside. We tend to send overly complicated reports with too much information that few people have time to understand.
In this Lightning Demo, I'll show you how LASTRADA uses simple graphics and customizable views so each user sees only the information that helps them do their job. This is a fully expanded version of LASTRADAs KPI module showing one product. You can find a number of available reporting options for the product itself and a number of six-sigma statistics for each product on a number of properties. The system also includes a graphic showing you your average and standard deviations relative to its targets.
Here's the same LASTRADA KPI module but at a much higher level showing operating compliance grade. I can use
this operating compliance grade to compare plants within a region, regions against each other, or locations in a company. Here is that same product view but reconfigured for a technician. We've reduced the information about
the product itself, we've provided some basic high-level statistics about the product and when we get into the individual tests we're just showing how many tests were taken, how many failed what's the percentage of time the materials in specification and that same graphic that shows the average and standard deviation of a test result relative to its specification range. It is also important that you prioritize your products when comparing in benchmarking plants against each other. So in LASTRADA you have the ability to prioritize each of the
products that you're producing at your aggregate and asphalt plant and you can also exclude products that are very low risk to your business.
For more information about how LASTRADA can simplify your work check out our other Lightening Demo videos at www.lastradapartners.com/resources or visit our contact page to speak with one of our engineers.


