
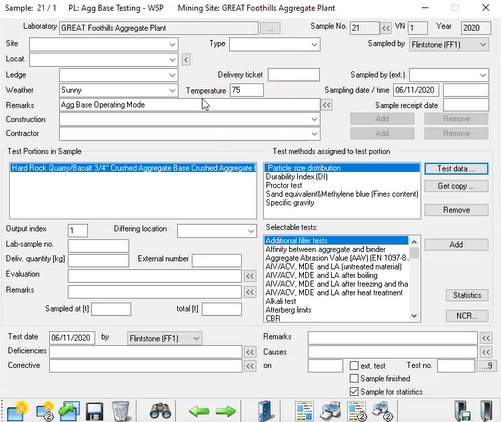
Aggregate FPC Module
The Aggregate Production Module documents the operating mode that the plant is running in, associated products, and desired tests.
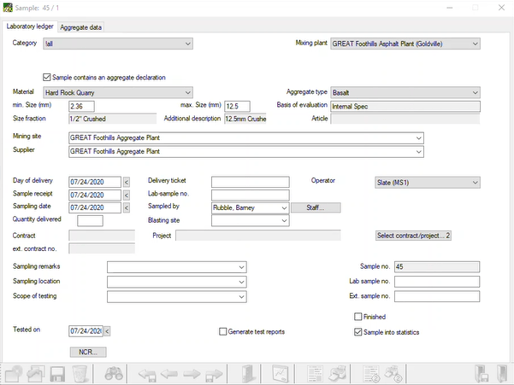
Aggregate Receiving Inspection Module
For hot-mix asphalt, the Aggregates Receiving Module only shows aggregates available for use at that asphalt plant and quality tests relevant to HMA quality control. For concrete, the Aggregates Receiving Module only shows aggregates available for use at that concrete plant and quality tests relevant to concrete quality control.
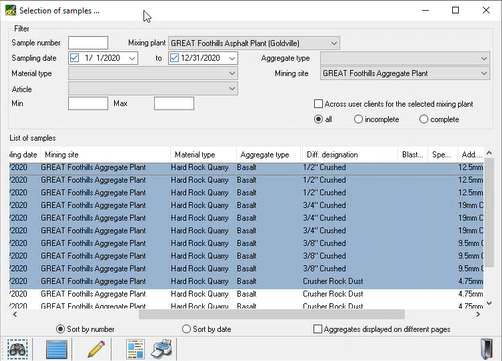
End-Use Data Structure
Statistics reports can be generated from the perspective of the aggregate plant using aggregate QC statistics...
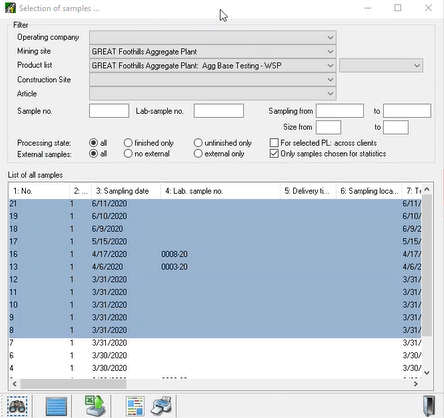
...or from each asphalt or concrete plant respectively.
With our end-use data structure, finding your data is simple. LASTRADA's modules are separated into asphalt, aggregate, and concrete to keep data organized without any extra steps for users.
VIDEO TRANSCRIPT:
When using simple flags and filtering all too often aggregate data ends up in the wrong bucket.
You waste time cleaning up flags and categories before you can start your
analysis.
In this Lightning Demo, I'll show you how LASTRADA's in-use data structure naturally prevents errors and allows
users to efficiently find and analyze aggregate information. When I'm in aggregate plant testing aggregates. I use the aggregate FPC. This allows me to look at the aggregate plant that we're working at, along with the operating mode that the aggregate plant is running in. The products associated with that operating mode along with the test that I would like to perform on those products.
When I'm testing at the hot mix asphalt plant and I'm looking at aggregates that are being received, I use the aggregate receiving inspection. This allows me to look at the aggregates that are available for use for hot mixture,
hot mix asphalt at that plant. By capturing the data based on the end use perspective, I can then do statistics
either from the perspective of the aggregate plant using the aggregate FPC or from the hot
plant looking at the aggregates coming in from that aggregate plant, and now here's an example of a statistics report from the aggregate plant or from the perspective of the hot plant.
For more ways LASTRADA can simplify your work check out our other lightning demo videos at www.lastradapartners.com/resources or visit our contact page to speak with one of our engineers.

