
The Statistics Module
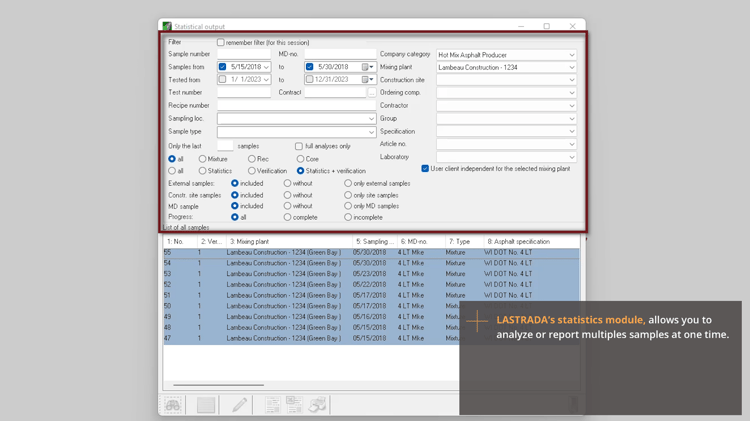
In the Statistics Module, you can easily find information entered in the field in real time with the multiple search options in LASTRADA. This allows you to quickly find relevant information and make quick and accurate decisions.
Statistics Reporting
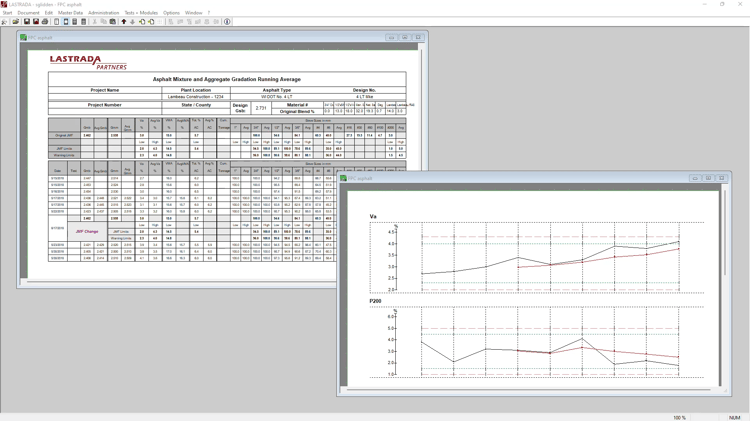
Once you have narrowed down the data you want to see, you can run a statistics report and see that data side by side in a table format and a graph.
Informed decisions based on data immediately available after testing is completed.
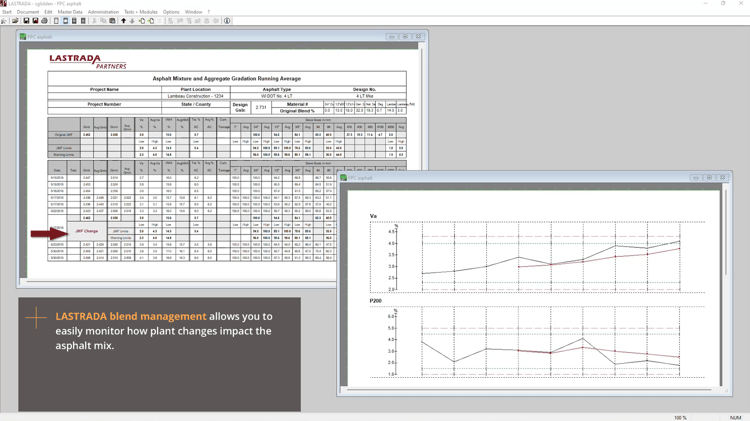
In the below example, you can see in the table that a JMF change was made before the last three samples were tested. The graphs show that the air voids are trending out of specification based on both the single sample points and the running average. At the same time, the P200 is trending down. You can use this information to quickly make a blend change in real-time to ensure your mix stays in specifications.
VIDEO TRANSCRIPT
Collecting and organizing data can be a time-consuming and challenging process with other solutions. In this Lightning Demo, I will show you how to quickly analyze production data. It is very easy to find the data you want with LASTRADA's Statistics module, which includes multiple search options, allowing you to quickly find what you need in real-time.
Use a table or graph to analyze the data that you have filtered with the statistics selection. In this example, you can see that there is a GMF change made before the last three samples were run. Looking at the graph you can see that your air voids are close to going out of specification and you can see that it's probably because your P200 is going down. LASTRADA allows you to make quick and informed decisions, reducing work stoppages and penalties.
Thank you for watching; for more ways LASTRADA can simplify your work, check our other Lightning Demo videos at https://www.lastradapartners.com/resources or visit our contact page to speak with one of the engineers.

