
OVERVIEW:
In continuing our efforts to innovate the aggregate quality control process, LASTRADA Partners set out to find an improved, proactive approach to aggregate QC. We repurposed the European oversize/undersize specification into a quality control method that directly identifies problems in reduction, screening wear, and carry over.
This proactive QC method can be implemented using either Microsoft Excel or LASTRADA™.
- Non-LASTRADA users can download the free Excel template here.
- Current LASTRADA users can download the LASTRADA template and the Excel template from the Customer Resource Center.
In this video, we use customer data to demonstrate an alternate technique for managing production efficiency. We found a change in crusher feed rate through our oversize/undersize method, which could not be seen when using common QC techniques. Tracking a product’s oversize gives us a direct measure of screen wear on a screen deck, while tracking undersize measures the screening efficiency of the same deck. Looking at oversize of all products together measures crusher consistency. Our approach is aimed at directly monitoring the consistency of screen decks while performing typical quality control, providing early indications of production changes before the aggregate products fall out of specification.
EXPECTED OUTCOMES:
After this video, you’ll be able to:- Define an aggregate product's oversize and undersize
- Implement screen deck efficiency reporting
- Utilize oversize and undersize analysis to identify aggregate production changes
If you're currently having issues with managing screening efficiency on a project and would like some additional assistance, you can request a consultation with one of our engineers.
VIDEO TRANSCRIPT:
We typically control aggregate production by measuring finished gradations. This is a reactive approach to process control with no specific feedback as to where to investigate when there is a problem. When you are investigating failed gradations, you must look at reduction, screening, and washing. Evaluating screening is challenging because an individual screen deck can affect multiple aggregate products. I want to discuss an alternate, proactive approach for performing quality control on an aggregate screening, where we directly monitor the consistency of each screen deck.
In this Leveraging LASTRADA video, I’ll demonstrate LASTRADA’s oversized and undersized approach to directly monitor screen deck performance. This approach directs your attention to a specific screen deck before any of the potentially affected products fail specification.
LASTRADA users will find the template used in this video in the Customer Resource Center. Non-LASTRADA users can download an Excel version of the same report on our website.
Let's review this basic aggregate screen deck diagram to understand the concepts of oversize and undersize in LASTRADA. You will see similar screen decks in aggregate production facilities and in asphalt batch plants. This example screen deck sorts aggregate into four size fractions.
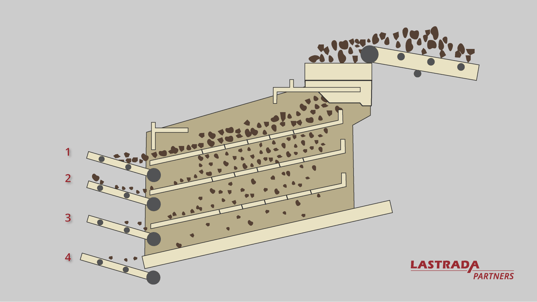
If I look at the second product in this screen deck, the oversize is the aggregate size in the sieve set that indicates the consistency of the screen above. We track the percent retained of the oversize and therefore monitor amount of material we expect to be passed or retained on the above screen deck.
The undersize is the sieve that indicates the consistency of the deck below. We track the percent passing of the undersize and therefore monitor the amount of material passing in this product or retained into the product below. Some would call undersize "carry over".
In LASTRADA, you define a product’s oversize and its undersize in the aggregate product production specification. The relationship, or order products in the screen deck, is defined by the output index of a product list in LASTRADA. If you are using our Excel tool, the output index, oversize, and undersize are selections in the spreadsheet.
Let’s look at some plant data. This data is from a currently producing aggregate plant. I will start by filtering in data from the screen deck product list, and running a standard gradation report that shows cumulative percent passing and control charts of the same data. When you review the data, you can see the ¾” product as running coarse on the ¾” and ½” screen during this period of time right here. The ½” sieve is also coarse during that same period of time on the ½” and the 3/8” sieves. The 3/8” product appears to be unaffected during this period of time, and if anything it might be running a little more fine on its coarse aggregate sizes.
Let’s now run the screen efficiency report on the same data. This page of the screen deck consistency report provides a basic overview of both the oversize and undersize of each of the products on this screen deck. Some basic statistics - means, standard deviations, minimum, maximum, and range - of both the undersize and oversize of each product. I am going to move to the next page of this report where we graphically look at the oversize results together. This is the period of time where we had identified both the ¾” and ½” as being coarse, and we can see their oversize trends are both trending up, so we have more oversize in these products during that period of time.
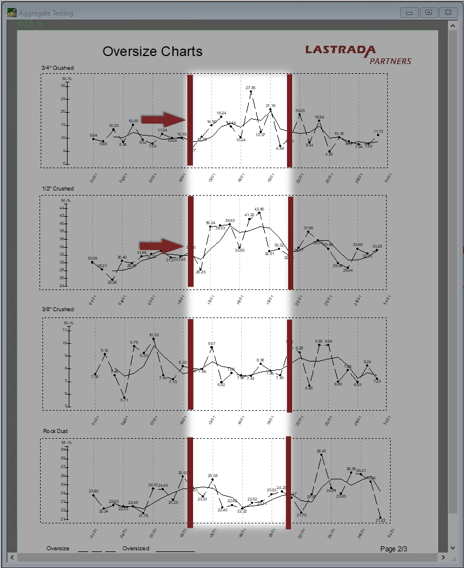
But when we look at the 3/8" crushed and the rock dust during that same period of time, we can see that they actually have less oversize material or coarse material in their products during that same period of time.
When we see an increase in oversize in this product and the second product, and a corresponding decrease on the third and fourth products, the most likely root cause of this change is reduction or crushing.
If I had to guess, I would suspect that during this period of time the crusher itself was not choke fit and was yielding a slightly coarser product over the screens to be sized.
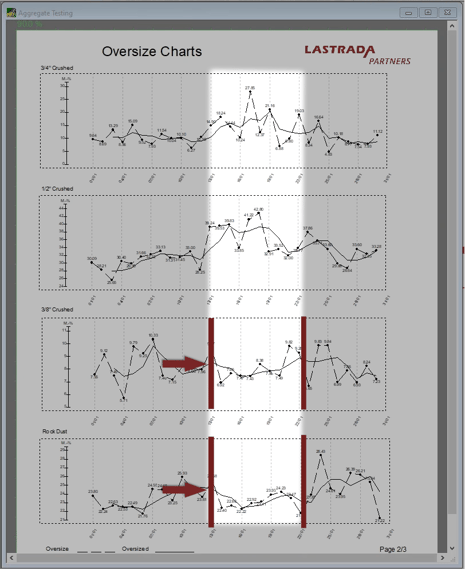
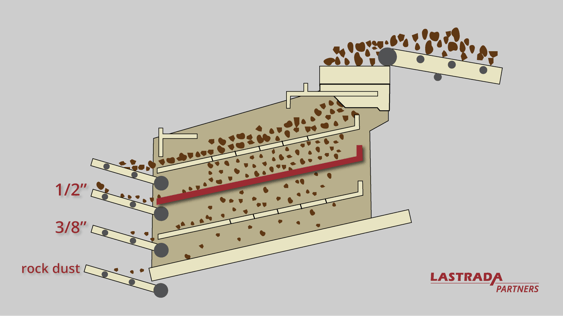
Now let’s go look at excess fines or carry over. We're going to go back to the statistics report we were looking at earlier and blow it up a bit. So let's look first at the 3/8” product. Now we can see the fines portion of the 3/8" products during this period of time is getting coarse. If we go through and we look at the product below the manufactured fines, we see the same behavior her in the #8, #16, #50, and #100 sieves. Let's go look at the undersize portion of our report and see what that tells us. We see in this undersize report the amount of undersize or fine materials in both the 3/8" crush and the rock dust is decreasing during this period of time, which we knew in the gradation results. But what we also see in that same period of time is an increase in undersize material in the ½” crush product.
What that indicates to us is that this screen, the undersize screen at the ½”, is blinding over and the fine material that we would expect to see in the 3/8" and rock dust is being retained here in the ½” material.
Since we're talking about blinding over, we would recommend you also add moisture content data to these reports. Unfortunately our example data set did not include moisture content data, and it is not included in this video. This example, again, was used from an aggregate production facility data set. The same technique is applicable to asphalt batch plants.
Thank you for watching. For more tips like this one, check out our other Leveraging LASTRADA videos at lastradapartners.com/resources. LASTRADA Partners employs registered professional engineers and industry veterans that can help solve problems such as this one. You can schedule a free consultation with one of our engineers by going to our contact page.
Non-LASTRADA users can download the Excel file used in this video on our website. Customers can download the LASTRADA template and Excel file used in this video in the customer support center.
