
OVERVIEW:
Voids in mineral aggregates (VMA) is a property used in many asphalt specifications to ensure asphalt mixes will perform as designed. Unfortunately, it is not uncommon for a contractor's and agency's VMA results to not match. If one examines the influence of each of the three measurements that make up voids in mineral aggregates, the right adjustments can be made by both parties to successfully reconcile any differences.
In this second video on VMA, we share a technique for ranking the importance of each of the three measurements used to calculate voids in mineral aggregates. We review the mathematics behind VMA and highlight the significance of proper rounding in our calculations.
A demonstration is provided, and analysis can be duplicated using Microsoft Excel and LASTRADA™.
- Non-LASTRADA users can download the free Excel tool here.
- Current LASTRADA users can download the LASTRADA template and the Excel file from the Customer Resource Center.
If you're currently having issues with VMA on a project and would like some additional assistance, you can request a consultation with one of our engineers.
EXPECTED OUTCOMES:
After this video, you’ll be able to:- Compare two data sets with different VMA results
- Calculate the resulting difference from each measurement
- Rank measurement importance by resulting VMA difference
VIDEO TRANSCRIPT:
Major highway projects require testing by both the contractor and the agency. QC QA if you will. Unfortunately, those results don't always match. This causes project delays, some difficult workdays, and in extreme cases, a loss of trust.
VMA is a place where QC and QA results commonly do not agree. VMA is also an important part of our asphalt specifications, so it is important that they do agree. There are a number of measurements that go directly into calculating VMA. There are other measurements that affect VMA but are not directly a part of the VMA calculation itself. Understanding the influence of each of these measurements is key to understanding where the differences between two data sets may come from.
In this Leveraging LASTRADA video, we're going to review an example of QC and QA VMA measurements and pinpoint why the results are different. LASTRADA customers can download the LASTRADA template and Excel spreadsheet used in this video from the Customer Support Center. Non LASTRADA users can download the Excel spreadsheet used in this video from our website.
Let's start by looking at the equation we use to calculate VMA. This equation is published by the Asphalt Institute in their manual series # 2 or the MS2 asphalt mix design methods.
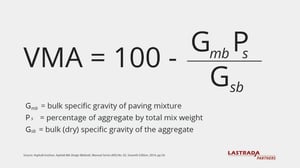 There are three measurements that go into actually calculating VMA. The first is Gmb or the bulk specific gravity of the mixture. The second is Gsb or the bulk specific gravity of the aggregate, and third, Ps which is the percentage of aggregate. Ps is calculated by subtracting the percentage of binder or PB not shown on this slide from 100. From those three numbers, I can calculate VMA. Let's look at some example data in LASTRADA.
I'm going to go into the stats module and query in some example information. I'm gonna look at this sample number 105. When I pull up sample 105, I have two copies of the sample. One is marked verification, and that has a VMA of 12.5. The next sample has a VMA of 13.2 - and it is not marked verification, meaning that this is the QC sample from the producer. So in theory, these are split samples of the same material produced and we have a difference in VMA. We need to look at why the numbers are different.
If we go back to the equation, we can see there were three measurements that went into calculating VMA: The bulk specific gravity of the mixture Gmb, the bulk specific gravity of the aggregate, Gsb, and Ps, which is a function of the binder content. We went ahead and created a custom report to bring those three measurements to the surface for you. I'm gonna run that report on the two samples we were just looking at, and now I've got my binder content, my mixture bulk specific gravity, and my aggregate specific gravity pulled out for me to look at, and I have the two numbers of VMA.
When I look at the numbers, there doesn't appear to be a huge difference between the measurements a 44 versus a 41, a 388 versus a 372, a 610 versus a 620. We have three measurements and three differences. How do we know which of these measurements has the most impact on the difference that we see in VMA? We've gone ahead and created an Excel file for you to mathematically show us which of these three measurements has the most impact on the difference in VMA that we see between the two data sets.
The idea is that we start with the measurement that has the most impact on VMA we investigate the source of the difference. We get the values closer together or as close together as we can get them, and then we move on to the next. And when we're done, hopefully we get lab results that are within a range of each other that everyone is comfortable.
I'm gonna launch this Excel file that we've created, and in this Excel file, we're gonna put the three numbers that go into VMA from the QC lab in data set “A” and the numbers from the QA lab in data set “B”.
I'm gonna tile my screen so that we can take a look at what we have here from the two labs. For starters, this Excel file has the ability to look at rounding (and we’ll talk about the impact of rounding later on in this video) but let's just start with the numbers as we see them in LASTRADA.
So, the binder content from the QC lab is one-tenth of a percent, The binder content from the QA lab is one-tenth of a percent, and so on. I went ahead and entered the LASTRADA data into the spreadsheet.
The spreadsheet is telling us a few things. First, data set “B” has a VMA that is seven-tenths of a percent lower than data set “A”, which is 5.3% lower than the 13.2, and then we can use these next three sections here to help us understand which of the three measurements that go into calculating VMA have the highest impact on the difference that we saw between data set “A” and data set “B”.
This spreadsheet will mark that with an "X" for you and show you as a percentage what each of these differences are. So if we just look at the binder content to start, the binder content, actually the difference in binder content I should say, actually increased VMA by two-tenths of a percent, which was 16.7% of the difference that we saw between the two data sets.
The Gmb difference had a reduction of six-tenths of a percent in VMA, which was half of the difference that we saw between the two data sets. And then lastly, the Gsb difference between the two data sets resulted in a four-tenths difference lower than the 13.2, and that was 33.3 percent of the change that we saw between the three values.
We should start looking at the Gmb's. Look at the processes for processing the sample, for taking the weights in air and water and SSD, and in turn try to identify areas where we can be more similar in our processes and processing to bring these numbers closer together. Once we have the Gmb set, then we might look at Gsb next and binder content last.
I want to close this video with a brief discussion of rounding. I think most everybody knows that when I click on a number here and use this button to increase or decrease the number of decimal places, that doesn't round the number; that just changes what I'm seeing on the screen. And every state and municipality has a specified test method - a specified number of significant digits for reporting each of these three values that go into VMA. As well as, there could be a specified rounding technique: bankers rounding verses mathematical rounding. Now in LASTRADA, we handle that for people with a drop-down menu labeled “Differing Rounding Rules.”
You can use the spreadsheet to see what the influence of rounding might be on the data set. So I'm gonna go ahead and change the specified number of decimal places for the Gmb and Gsb to 2. I'm gonna go ahead and add a decimal place to my binder content. I'm gonna go ahead on this number I'm gonna add a few more numbers down here and you can see what the spreadsheets telling me is just by decreasing the two decimal places and adding a digit here, I've actually got eight hundredths of a percent less VMA, which actually would round to 1/10. Not totally significant. A tenth of a percent in VMA is not significant. It's probably within our ability to measure, but if you're looking at the differences between two data sets like we were looking at earlier, it's really important that everybody's following the same rules. So we've added that as another feature of the spreadsheet for you to use to look at the impact of rounding when you think another data sets not being rounded or they're not following the rounding rules of the local municipality.
Thank you very much for watching the video. Again, the LASTRADA template is available for download from the customer support center along with the Excel file, and you can also download the Excel file from our website. Thank you for watching and we look forward to meeting you in the future. For more ways to manage VMA, check out our Understanding VMA video series at lastradapartners.com/resources.
For more information on how LASTRADA helps asphalt producers, visit our asphalt solutions page.
