
OVERVIEW:
When LASTRADA Partners provided consulting services to plants where rubberized hot mix asphalt (RHMA) did not meet the minimum Hamburg Wheel Tracking test criteria, we learned that the key to maximizing or maintaining Hamburg Wheel Tracking test results is to un-gap the gradation as much as possible while still maintaining acceptable tolerances.
In this video, we share techniques for optimizing gap-graded rubber gradations and designing asphalt mixes compliant with new Hamburg rutting criteria using the 0.45 power curve. We highlight how to maintain the desired gradation throughout production and find the optimal Hamburg Wheel Tracking test performance.
A demonstration is provided, and analysis can be duplicated using Microsoft Excel and LASTRADA™.
- Non-LASTRADA users can download the free Excel template here.
- Current LASTRADA users can download the LASTRADA template and the Excel template from the Customer Resource Center.
If you're currently having issues with Hamburg performance on a project and would like some additional assistance, you can request a consultation with one of our engineers.
EXPECTED OUTCOMES:
After this video, you’ll be able to:- Optimize gap-graded gradations for Hamburg rutting performance
- Design asphalt mixes compliant with new Hamburg rutting criteria
- Maintain Hamburg rut performance throughout production
VIDEO TRANSCRIPT:
The introduction of Hamburg wheel tracking to predict rut performance has added new complexity to designing acceptable rubberized or scrap tire modified asphalt. Some producers have found it challenging to design an asphalt mix that will withstand the minimum amount of loading required by their local agency. Crumb rubber modified mixes that have been previously acceptable have become unacceptable with this new rutting criteria.
In this leveraging LASTRADA video, we are going to show you how to use the 0.45 power curve to optimize gap-graded rubber asphalt modified gradations for optimal Hamburg performance. Just as important, we are going to show you how to properly maintain that desired gradation throughout production.
LASTRADA users can download the LASTRADA templates and Excel file used in this video in the Customer Resource Center. Non-LASTRADA users can download the Excel file from our website.
In this video, we’re going to work with something we call “shape factor”. And a shape factor, to us, is a way to quantify numerically how gapped a gradation is. A way you can look at that is looking at a gradation plotted on the 0.45 power curve. The 0.45 power curve plots the percentage passing cumulatively of an aggregate size on the Y axis, and on the X axis we have the sieve size, corresponding sieve size, raised to the 0.45 power. This blue line is the zero error voids curve, or the maximum density line. If this gradation were right on the maximum density line, we would think that the gradation would have nearly no space in its aggregate matrix for error or asphalt.
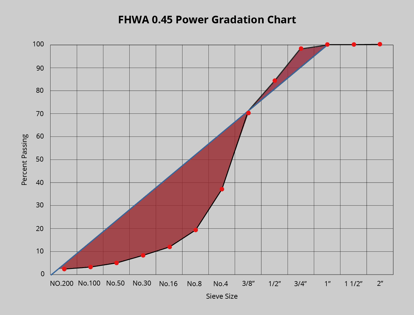
Another way to look at it would be that the shape factor would be essentially the area represented by this red shading here on that same gradation curve, so let’s look at that in LASTRADA. In some consulting projects, we started looking at the shape factor, or the area between the gradation curve and the 0.45 power curve, and its Hamburg wheel tracking results. And we started to find a correlation; that the lower the shape factor, the better the Hamburg performance. So with this information, you can then start to design mixes that will perform against the Hamburg wheel tracking test and let’s take a look at how you would do that.
Here we are looking at a mix design in LASTRADA. This mix design has four different aggregate trials on it, and let’s just assume at this stage we want to improve the Hamburg performance of this mix design. So we want to bring this red gradation curve even tighter to the 0.45 power curve. So how do we do that? So LASTRADA users are gonna come over here and they’re going to take that gradation and we’re going to export it into an XML file.
With the gap blending tool open now you can go ahead, go to the developer tab, and import the data that you exported. I’m gonna go ahead and select that file, and now my data has been imported for me. If you’re not using LASTRADA you can simply just go ahead and put in your own data at this stage too. There’s another version of this spreadsheet where the word LASTRADA is omitted from the file name.
So just a couple of notes about using the spreadsheet. Like it says here, every single cell here needs a number, otherwise the solver won’t work. So this mix design is actually pretty tight to the 0.45 power curve. The shape factors already 397.17. What does that number mean? It doesn’t really have a correlation to real life, it’s just a number, it’s an index number, if you will. But I want to go ahead and see if we can get even tighter, so what I’m gonna do is I’m gonna look at these settings here, and I noticed this is mineral filler.
These are the upper and lower limits that we’re going to allow possible blend values to go, so I’m going to set the upper limit on the mineral filler to 2%. This product is not being used, so I’m gonna set the upper limit on this product to 0, these wrap products I’m just gonna leave at 100 for now and then we would put in here our specification limits.
This spreadsheet has the solver tool built into it, and if you follow this link you can see how to install the solver tool, but I’m going to go here to data, solver, and then solve.
Now the software has actually continued to change these values for me, such that we have the smallest shape factor possible, and with these settings here we can now get that number from the 390 range down to 18. And just one more note about the solver, sometimes it doesn’t give you an answer, and if it doesn’t you can manually change these numbers here. I can change this to 5, I can change that to 10, and the spreadsheet will calculate the shape factor for me. So I can continue to, if the solver can’t give me an answer, I can continue to change these values until I see what the optimized value is. Now I’ve got a new mix design, I’ve optimized it, let’s say I go ahead and run that mix design trial. My Hamburgs are performing and now we’re going into production. Let’s talk about what to do next.
Okay now I’m back with that same mix design inside of LASTRADA in what we call the declarations, so now I’m taking that mix design into production at a particular plant. I’m on the blend tab, I’m in production, I’m concerned that I need to make a gradation adjustment, but I don’t wanna lose my Hamburgs. So what we’re gonna do here is we’re gonna use that same shape factor, and we’re gonna propose gradation adjustments to make gradation like we have done commonly, but now we’re going to add one more level to it.
We want to test the shape factor, so we’ve created a simple report here in LASTRADA and when I run that report, this report now is calculating the shape factor for this mix design. Now, is 1160 a good number? The answer is, I don’t know, but through experience you will find a value just like I showed you in a previous example of the LASTRADA report, where there was a value there.
When they stayed above that number, they failed and when that plant stayed below that number, it passed. So with a little bit of experience and a little bit of data mining, you should be able to find that value for yourself and keep yourself in specification for both gradation and error voids, and VMA and Hamburg.
Thank you for watching. For more tips like this one, check out our other Leveraging LASTRADA videos at lastradapartners.com/resources. LASTRADA Partners employs registered professional engineers and industry veterans that can help solve problems such as this one. You can schedule a free consultation with one of our engineers by going to our contact page. Thank you.
Non-LASTRADA users can download the Excel file used in this video on our website. Customers can download the LASTRADA template and Excel file used in this video in the customer support center.
For more information on how LASTRADA helps asphalt producers, visit our asphalt solutions page.
